Dividend Divergence
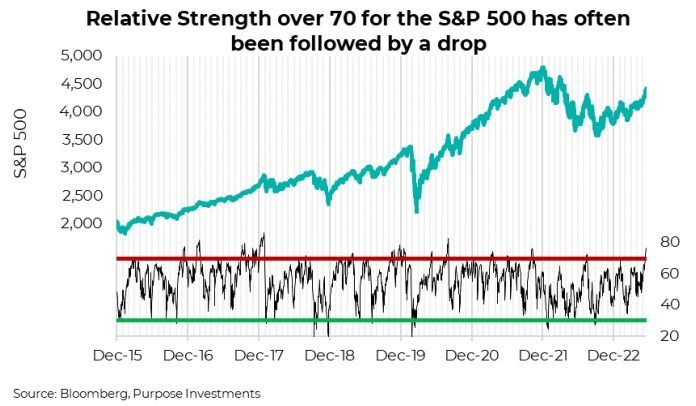
The headlines are currently dominated by stories or ‘financial explanations’ as to the jump in U.S. equities, enjoying one of the best weeks in months. AI, Fed pausing rate hikes, some decent economic data, and improving breadth are the most prevalent. Digging a bit deeper, it’s the abrupt change in sentiment (40% bearish a couple of weeks ago, now 23%), gamma trade, money market inflows became outflows last week, or while the refilling of the general account is sapping liquidity, the repo market is more than giving it back. And now we have the S&P 500 rallying to lift its relative strength (momentum indicator) into nosebleed territory.
We could devote a note to any one of these attention-grabbing topics and, of course, are totally open to discussing their influence… just give us a ring. But this week, we are diving into the dividend space, as there appear to be some very interesting changes afoot that really don’t seem to get any headline attention but likely have bigger potential portfolio implications. Especially given the healthy dividend exposure in most Canadian investors’ portfolios.
Investors often gravitate towards dividend-paying companies (or the dividend factor, if you prefer) for a number of reasons. Historically, this space has enjoyed lower volatility or beta than the general market. Plus, decent returns as well. Then there is the tax benefit of Canadian dividends; let’s call that the cherry on top of the dividend sundae. These are great long-term reasons to keep loving dividends, and the factor analysis below continues to support those characteristics.
However, the dynamics in the dividend space appear to have changed. We would contest that dividend-paying companies have enjoyed a positive performance influence from the 1980s till the end of the 2010s in the form of generally falling yields. Lower yields in the bond market simply make dividends-paying companies more attractive since everything is relative. When bond yields are 3%, a dividend-paying company with a yield of 6% may seem worth the added market risk. And if that bond yield moves to 2%, that makes the dividend-paying company still worth it at 5%, so the price goes up.
It was this long-term trend in falling bond yields that lifted all boats in the dividend space, from telcos to banks, to utilities to pipes to others. We believe it also contributed to the clustering of returns in the dividend space. In other words, the difference between one dividend strategy and the next was, on average, pretty narrow. You just needed to be in the space, and it didn’t matter how you did it, from buy-and-hold dividend stocks to passive strategies to rules-based or even actively managed solutions.
But now, with bond yields rising over the past couple of years, we have seen an increased divergence among dividend strategies. Essentially, the factors that have been driving performance in the dividend space have changed, which is good news. If changes in bond yields were still the dominant driver, well dividend companies would likely be lower in price given current yields. However, now other factors are having a bigger influence. These factors still include interest rate sensitivity but economic cyclicality, quality defensiveness appears to have an increased influence on performance. This can be seen in the divergence of performance among popular dividend ETFs and Funds.

If quality becomes the dominant factor, strategies that have more weight to this factor will perform best. If cyclicality is strongest, other strategies will do best. This creates a challenging environment as strategy selection, or the composition of a small basket of dividend payers, has likely become more important. It also supports taking a bit more of an active approach in the space. Rotating exposure may add value if a factor runs for an extended period and becomes expensive.
Cyclical yield is a bigger driver than interest rate sensitivity
One lens that we have used for over a decade to help manage dividend strategies is Cyclical Yield and Interest Rate Sensitivity. Essentially, cyclical yield names tend to be more sensitive to gyrations in economic activity and less to changes in bond yields. In an environment with rising or higher bond yields, cyclical yield tends to win. If yields are falling, the opposite. As you can see in the chart below, interest rate sensitives dominated in the 2010s (falling aqua line), and so far in the 2020s, it's been cyclical yield winning (rising aqua line).

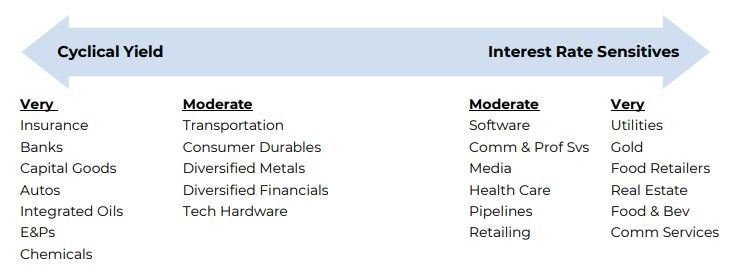
The question today is whether the cyclical yield names have run too far or if interest rates sensitives offer value given the current yield environment. So far in 2023, we have been cooling our enthusiasm for cyclical yield and currently have a more balanced view between the two factors. If you’re wondering what a cyclical yield company vs an interest rate sensitive is, we have the following spectrum at the industry level.
Digging into the dividend factor
With the explosive rebound of growth stocks this year, dividend stocks have certainly lagged. Using Bloomberg’s library of thematic factors, we delved deeper into the dividend factor to help explain some of this relative underperformance. Sector exposure has a lot to do with it. The chart below outlines the year-to-date sector performance as well as the sector weights of the top two quintiles of the divided factor for U.S. stocks. From a yield perspective, this is roughly any stock that yields more than 2%. The top sectors are Financials, Utilities, Real Estate, and Consumer Staples, all of which have significantly lagged behind the top-performing sectors (Tech, Discretionary, and Communication Services).

Digging more into the factors, the table below outlines the average quintile across a number of factors for dividend stocks. What’s clear is that higher dividend stocks are, on average, higher value, lower growth, and lower volatility. No real surprise here, but it’s interesting to see the math reinforce commonly held assumptions about dividend stocks. Size doesn’t jump out as a major factor across the dividend universe. However, when you look a little deeper and realize that out of the top nine largest stocks in the U.S., not one yields more than 0.8%, and the average yield is a paltry 0.24%. Collectively these nine stocks account for 28% weight of the S&P 500. There are lots of dividend stocks in the large-cap space, but when it comes down to the mega-caps (>$500 billion in market cap), dividends are clearly not prevalent.

Growth is by far the best-performing factor this year, but looking back over the past three years, value and dividends remain the best-performing factors, even with the recent troubles. The chart plots the long-only performance of the top quintile for each factor. What’s also promising is the recent reversal and uptick in value and higher dividend stocks. It’s surprising to see how little ground growth has made up after last year's collapse considering many of the top growth stocks that come to mind are at or back near their all-time highs. It’s really hard to get fully behind a factor driving performance when it’s literally just a handful of companies driving performance.

Final Thoughts
The dividend space in Canada is certainly a very mixed bag. Banks are under pressure as growth slows, real estate pricing is in either a big recession or ‘work from home forever,’ energy company share prices are high while valuations are crazy low, utilities with renewable exposure are down (those with none are up), and insurance companies are trucking along. Clearly not moving as one.
For the second half of 2023 and beyond, the question is which factors will be most influential, either positively or negatively. Will a potential recession become a headwind for cyclical yield names and instead reward those more defensive? Could yields come back down, lifting those more interest rate sensitive? The factors that drive performance seem to be changing more often these days. Set-it-and-forget-it used to work for dividends, but now it’s just for indoor grilling.
— Craig Basinger is the Chief Market Strategist at Purpose Investments
— Derek Benedet is a Portfolio Manager at Purpose Investments
Disclaimers
Source: Charts are sourced to Bloomberg L.P. and Purpose Investments Inc.
The contents of this publication were researched, written and produced by Purpose Investments Inc. and are used by Echelon Wealth Partners Inc. for information purposes only.
This report is authored by Craig Basinger, Chief Market Strategist, Purpose Investments Inc.
Insurance products and services are offered by life insurance licensed advisors through Chevron Wealth Preservation Inc., a wholly owned subsidiary of Echelon Wealth Partners Inc. This material is provided for general information and is not to be construed as an offer or solicitation for the sale or purchase of life insurance products or securities mentioned herein. Every effort has been made to compile this material from reliable sources however no warranty can be made as to its accuracy or completeness. Before acting on any of the above, please seek individual financial advice based on your personal circumstances. Please note that only Echelon Wealth Partners is a member of CIPF and regulated by IIROC; Chevron Wealth Preservation is not.
Forward-looking statements are based on current expectations, estimates, forecasts and projections based on beliefs and assumptions made by author. These statements involve risks and uncertainties and are not guarantees of future performance or results and no assurance can be given that these estimates and expectations will prove to have been correct, and actual outcomes and results may differ materially from what is expressed, implied or projected in such forward-looking statements.
The opinions expressed in this report are the opinions of the author and readers should not assume they reflect the opinions or recommendations of Echelon Wealth Partners Inc. or its affiliates. Assumptions, opinions and estimates constitute the author’s judgment as of the date of this material and are subject to change without notice. We do not warrant the completeness or accuracy of this material, and it should not be relied upon as such. Before acting on any recommendation, you should consider whether it is suitable for your particular circumstances and, if necessary, seek professional advice. Past performance is not indicative of future results. These estimates and expectations involve risks and uncertainties and are not guarantees of future performance or results and no assurance can be given that these estimates and expectations will prove to have been correct, and actual outcomes and results may differ materially from what is expressed, implied or projected in such forward-looking statements. Echelon Wealth Partners Inc. is a member of the Investment Industry Regulatory Organization of Canada and the Canadian Investor Protection Fund.
Share This Post


Call our office today for a private consultation about your Beyond Wealth needs.

Team Lairar
1565 Carling Avenue
Suite 600
Ottawa, Ontario
K1Z 8R1
LINKS
JOIN OUR MONTHLY NEWSLETTER
Contact Us


Please note that only Echelon Wealth Partners is a member of CIPF and regulated by IIROC; Chevron Wealth Preservation Inc. is not. *Insurance Products provided through Chevron Preservation Inc.