It's Priced In
Have you ever heard the words “it's priced in,” referring to the market or an investment pricing in some sort of potential negative event? The TSX is trading at 13x earnings estimates, historically low for this index, clearly pricing in some uncertainty or potential recession ahead. The S&P is trading at 19.7, which is historically high, implying the U.S. may not be pricing in much chance of a slowdown. Truth be told, in our years of investing, it's never completely priced in. Even the low-valuation markets will likely feel some pain if a recession does come. But likely less pain compared to those markets that are not pricing in any potential bad news.
Let us instead look at valuations as a safety buffer, never pricing in all the bad news but a portion or degree, depending on which investment or market you may be looking at. Using 20 years of valuation ranges, we broke down some major equity markets to contrast current and recent valuations. For instance, at the start of 2022, global equities were very close to record-high valuations. Then by the end of the year or the start of 2023, valuations were well below average. A bear market can do that. And now valuations are back up in the most expensive quartile.
Breaking it down a bit more, based on the past 20 years, the U.S., Japan, and NASDAQ are the markets priced to near perfection. While Canada, Europe and China are in the dumps, possibly pricing in a potential recession or at least partially priced in.

Of course, then the question is how to look at valuations. One could argue the last 20 years is not the greatest sample period. However, another factor is the 'earnings’ part of valuations. Earnings have contracted a bit over the past few months, but how far will earnings fall if a recession is coming? If they fall a lot, perhaps some of those markets that appear to be pricing in a decent amount of recession risk are not as cheap as they look.
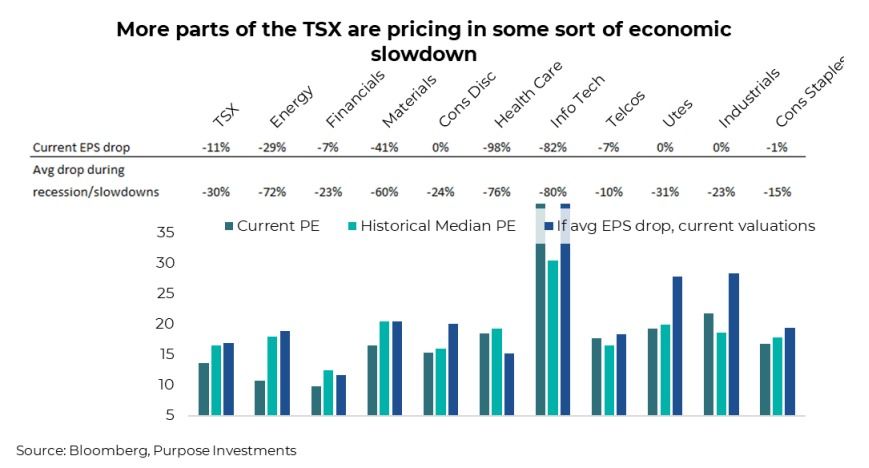
The chart below has a lot going on. The data table at the top of the chart shows how far each sector’s earnings have already contracted so far in 2023 and the average earnings contraction during past recessions and economic slowdowns. These include the 2001, 2008 and 2020 recessions, plus the economic slowdowns in 1998, 2015 and 2018. The bars below show the price-to-earnings today, the median over the past 30 years and what today’s PE ratio would be if earnings contracted by the average of past recessions/slowdowns.

For example, the energy sector is trading very cheap, and if earnings, which are already down 29%, fell by 68%, this would still have valuations roughly in line with historical norms. In other words, the energy sector appears to be pricing in a good amount of recession risk. The same can be said for Health Care, which actually tends to hold up well during periods of economic weakness. Materials, Financials, and Telcos are not pricing in as much risk but still a decent amount. On the other end of the spectrum, Information Technology, Industrials, and Consumer Discretionary sectors do not appear to be pricing in much risk.
We did the same thing for the TSX. Not surprisingly, TSX often sees bigger contractions in earnings during periods of economic weakness. The good news is that valuations are low, and if we have an average earnings recession, current valuations are just about in line with historical norms, as do financials and energy. We would caution against making conclusions on some sectors given the narrowness of companies or other ‘TSX’-centric nuances.
Credit Markets
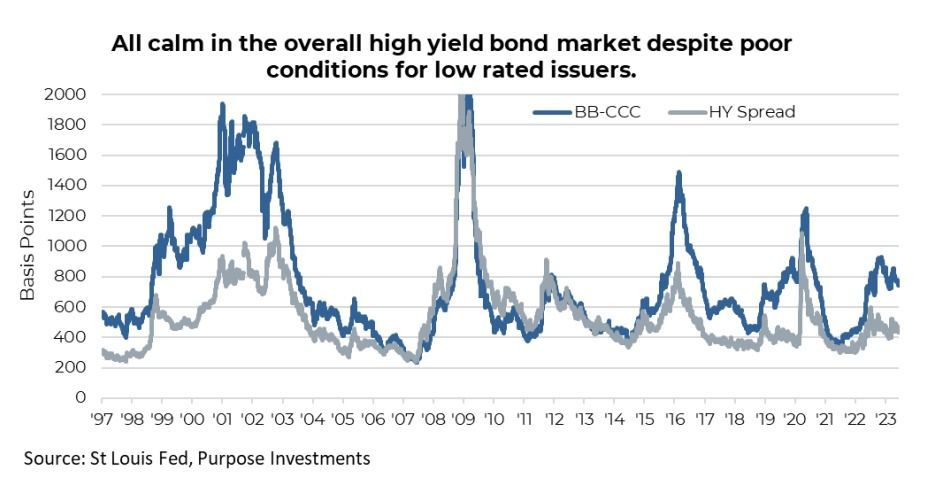
For the most part, credit markets are signaling some degree of caution, but despite recession fears, spreads have not widened dramatically. In fact, they have fallen a decent amount over the past couple of weeks and remain well below the recent highs seen last September. With high yield spreads currently at +433bps, they are a little elevated, but not much. The credit market is discounting relatively benign economic conditions going forward. Within the high-yield space, lower-quality, CCC-rated corporate bond spreads are perhaps telling a slightly different story. The bifurcation of the high-yield bond market remains elevated. More credit-worthy companies are still able to borrow at more reasonable spreads; however, the gap between BB and CCC-rated spreads is considerably wider compared to other periods corresponding with similar spreads in the high-yield market. The lowest-rated junk bonds are showing meaningful credit risk in the U.S.
Spreads between BB and CCC corporate bonds are in a bit of a twilight zone right now. Historically this zone is where spreads spend some time digesting forthcoming credit conditions before jumping higher during a liquidity/credit crunch. We’ve yet to see any real spike.
Some investors may hold off getting excited about high yield, perhaps waiting for spreads to blow out between 600 and 800 basis points based on where they topped out prior to previous recessions or economic slowdowns. The space is somewhat enticing with a yield-to-maturity in the large U.S. junk bond ETFs north of 8%. For now, we’re comfortably less exposed to the space. We believe we’ll get a better opportunity when spreads take heed from the early warning call from the lower-quality borrowers.
Commercial Real Estate
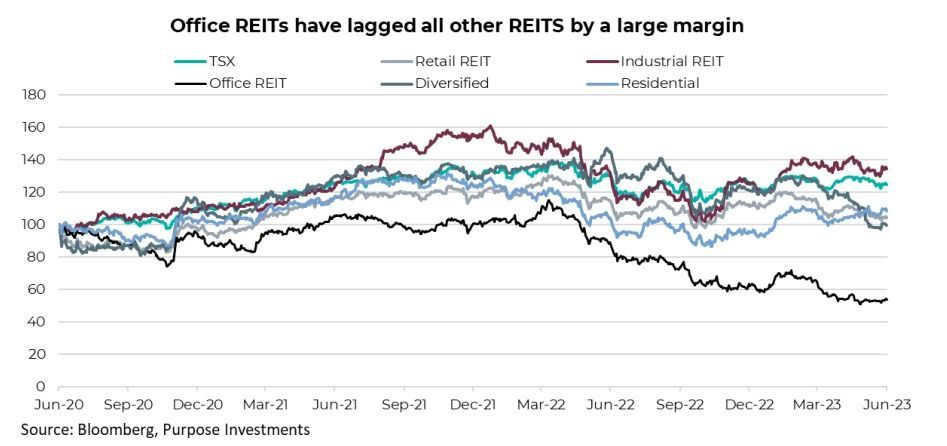
Concerns over the office real estate sector following the pandemic have increased over the past few months, in part due to the mini banking crisis among U.S. regional banks. Whether it's rising rates, sky-high vacancy rates thanks to a painfully slow return to office or concerns over leverage, there is no shortage of bad news or bear case arguments. No doubt, there are a lot of troubled office buildings, as well as other troubled properties such as malls etc. The risks inherent in the space are high, but the prices of many of these REITs are also incredibly low. Canadian Office REITs are down 55% from their pre-pandemic high. The total return index is down to levels last seen in early 2016. The spread between Office REITs and other types widened considerably this year as seen in the chart below. There’s also a large disconnect between the public and private markets. At some point – and to be clear, we don’t know if we’re there yet – office REITs will be a buy simply because they have overly discounted a worst-case scenario.
Determining when enough of the bad news is already priced into the market is a challenging but potentially lucrative task. It involves a lot of subjective judgement simply because if there was enough hard data to reinforce the view, the market would have already reacted to it. Some of the factors to assist in trying to address this are market sentiment, lack of a market reaction on bad news as well as digging into the fundamentals and factoring in worst-case scenarios.
Final Thoughts
This is an interesting time for investing. Parts of the market are rich with euphoria and are paying no mind to valuations. Other parts are clearly pricing in a lot of bad news. ‘It is fully priced in’ never really comes to pass because we never know what ‘it’ is or its depth and duration. The good today is whatever ‘it’ is; parts of the market have priced in a decent portion. And that provides a bit of a safety buffer. The same cannot be said about other parts of the market.
— Craig Basinger is the Chief Market Strategist at Purpose Investments
— Derek Benedet is a Portfolio Manager at Purpose Investments
Disclaimers
Source: Charts are sourced to Bloomberg L.P. and Purpose Investments Inc.
The contents of this publication were researched, written and produced by Purpose Investments Inc. and are used by Echelon Wealth Partners Inc. for information purposes only.
This report is authored by Craig Basinger, Chief Market Strategist Purpose Investments Inc.
Insurance products and services are offered by life insurance licensed advisors through Chevron Wealth Preservation Inc., a wholly owned subsidiary of Echelon Wealth Partners Inc. This material is provided for general information and is not to be construed as an offer or solicitation for the sale or purchase of life insurance products or securities mentioned herein. Every effort has been made to compile this material from reliable sources however no warranty can be made as to its accuracy or completeness. Before acting on any of the above, please seek individual financial advice based on your personal circumstances. Please note that only Echelon Wealth Partners is a member of CIPF and regulated by IIROC; Chevron Wealth Preservation is not.
Forward-looking statements are based on current expectations, estimates, forecasts and projections based on beliefs and assumptions made by author. These statements involve risks and uncertainties and are not guarantees of future performance or results and no assurance can be given that these estimates and expectations will prove to have been correct, and actual outcomes and results may differ materially from what is expressed, implied or projected in such forward-looking statements.
The opinions expressed in this report are the opinions of the author and readers should not assume they reflect the opinions or recommendations of Echelon Wealth Partners Inc. or its affiliates. Assumptions, opinions and estimates constitute the author’s judgment as of the date of this material and are subject to change without notice. We do not warrant the completeness or accuracy of this material, and it should not be relied upon as such. Before acting on any recommendation, you should consider whether it is suitable for your particular circumstances and, if necessary, seek professional advice. Past performance is not indicative of future results. These estimates and expectations involve risks and uncertainties and are not guarantees of future performance or results and no assurance can be given that these estimates and expectations will prove to have been correct, and actual outcomes and results may differ materially from what is expressed, implied or projected in such forward-looking statements. Echelon Wealth Partners Inc. is a member of the Investment Industry Regulatory Organization of Canada and the Canadian Investor Protection Fund.
Share This Post


Call our office today for a private consultation about your Beyond Wealth needs.

Team Lairar
1565 Carling Avenue
Suite 600
Ottawa, Ontario
K1Z 8R1
LINKS
JOIN OUR MONTHLY NEWSLETTER
Contact Us


Please note that only Echelon Wealth Partners is a member of CIPF and regulated by IIROC; Chevron Wealth Preservation Inc. is not. *Insurance Products provided through Chevron Preservation Inc.