Earnings Optimism
There are three things you should rarely ever bet against: the Leaf’s opposing team in the playoffs, the American consumer’s ability to spend, and corporate profits. As we are now about halfway through U.S. earnings season, once again, positive surprises remain the norm; 81% have beaten. It's a bit better than the 20-year average of 75%. The fact is that companies are good at managing analysts’ expectations. At least enough to beat them when the numbers hit the tape. The size of the positive surprises have been encouraging as well, at just under 10%. The highest surprise magnitude in some time.
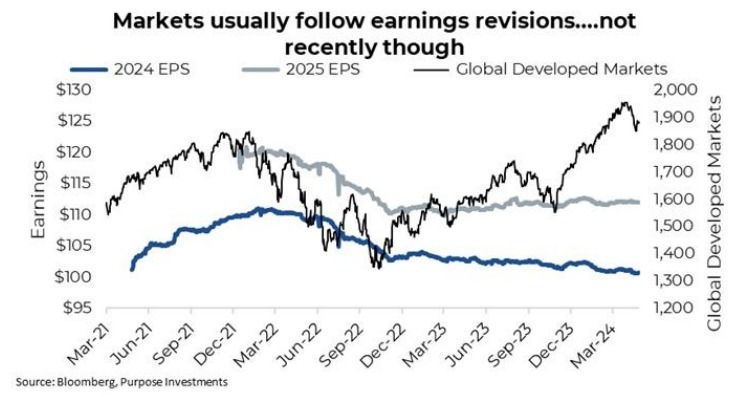
One of our reservations on the sustainability of this market rally over the past couple of quarters has been the flat earnings revisions. In other words, global markets are up over 20% but earnings estimates have remained flat or tilted down slightly. More often than not, markets trend in the same direction as earnings revisions. Earnings get revised up when companies raise guidance and/or analysts become more encouraged about growth prospects. That is a good thing for markets. Obviously, downward revisions are bad. Yet estimates have remained very flat as markets marched higher, a challenging combination.
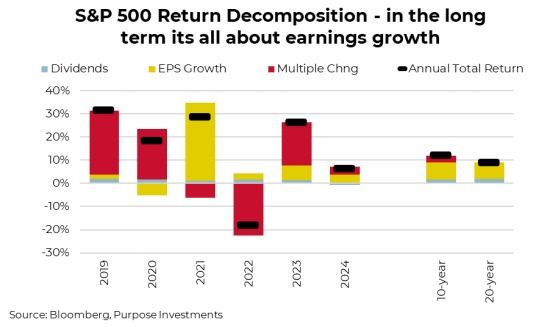
Of course, the reason earnings matter so much is they are everything in the longer term. Sure, the market can move up a lot or down a lot as the optimism or pessimism about the future waxes and wanes. But all this tends to average out, leaving earnings growth as the real driver of market performance. We have used the chart below a few times over the years, but it really does highlight where market returns come from. In any single year, the red bar dominates as fear/greed causes the market multiple to rise or fall. Yet once you look at 10 or 20-year periods, the red bar disappears as it is all about earnings growth (yellow bar), plus some dividends.
Given the importance of earnings, a good earnings season is a welcome boost to markets. The question is whether this good season will translate into rising revisions for forward estimates. So far, it has not. Global earnings from the earlier chart show 2024 still trending ever so slightly lower and 2025 more stable to ever so slightly higher. Looking at just the U.S. market, it is rather similar. 2024 earnings are forecast at $243, the same number as of January 1st. 2025 looks a bit better, with consensus estimates of $270 rising to $275 so far this year.
Digging down to the sector level, it seems just a couple of sectors, including Energy, Info Tech, and Communication Services, are lifting the overall market earnings. Energy makes sense as commodity prices have been trending higher, tech too, given the excitement spending around AI. Communication Services is an odd one on the surface but is mainly Alphabet. Traditional telcos are seeing estimates fall.

So where do earnings go next? There are some decent headwinds for U.S. earnings. One is a higher U.S. dollar, running a bit higher than last year. Given the amount of earnings that come from overseas, once translated back to USD, a strong dollar is a negative. The bigger drag may be interest expense. Last quarter, S&P 500 companies paid $68 billion in interest expenses, which is up from $59 billion a year ago. Variable interest obligations have already adjusted to the higher rate world, but the fixed-term obligations will only reset once they mature. In other words, even if yields/rates start to come down later this year, interest expenses will likely keep rising for many quarters to come.
Wages and other corporate input costs are also a negative for future earnings. On a positive note, wage pressures have been trending lower. The Atlanta Fed Wage Growth Tracker peaked at 6% in 2022 but has been steadily falling for over a year down to 4.7%. That is not bad, considering that historical norms were in the 3- 4% range.
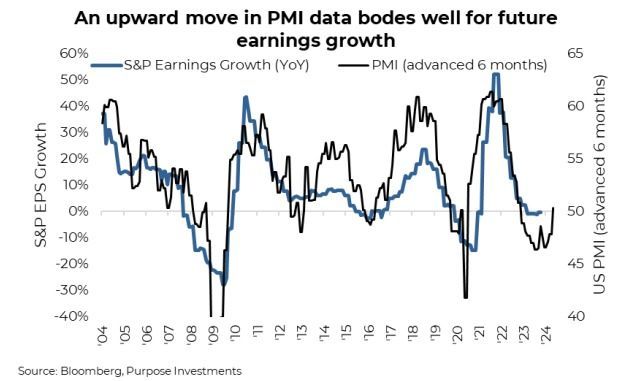
Despite these headwinds, there are some very positive factors as well. U.S. earnings tend to be highly correlated to manufacturing activity. S&P 500 year-over-year earnings growth tracks PMI (Purchasing Managers survey) with a six -month lead. Which means the uptick in PMI data we are seeing today bodes well for earnings growth in the coming months.
The economic data, globally, has been improving. This should result in further earnings growth and upward earnings revisions. The Citigroup economic surprise index for the world has been positive for most of 2024 so far. This means that economic data is coming in better than consensus estimates. And if you ask copper, with its honorary PhD in economics, maybe things are even heating up more so. Given how many areas of economic activity consume copper, its price moves are often a precursor for the move in the economy. Copper prices have recently risen through $4/lb, a level not seen since 2021/early 2022 as the economy emerged from the pandemic.
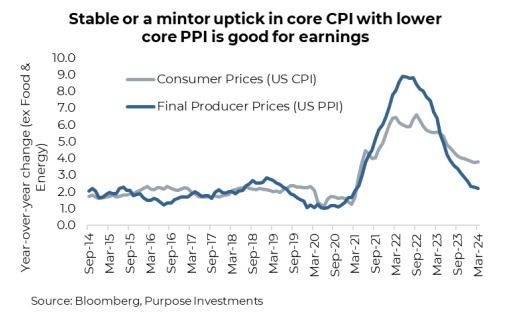
The final good news may be inflation. Inflation sucks; it is a tax on your future spending power or the value of your wealth. But for earnings, inflation is good. It means companies are able to raise prices, and when Producer Prices (PPI) are rising slower than Consumer Prices (CPI), that is an earnings-healthy combination.
Final Thoughts
Earnings probably have more going for them than against them these days, which is a good news story. Hard to say if it will be enough to maintain the gains of the past few quarters, but it certainly would be helpful. The U.S. earnings season is halfway through the Q1 season and it has been good. Hopefully this trend persists. And, hopefully, the Leaf’s playoff trend doesn’t.
— Craig Basinger is the Chief Market Strategist at Purpose Investments
Disclaimers
Source: Charts are sourced to Bloomberg L.P. and Purpose Investments Inc.
The contents of this publication were researched, written and produced by Purpose Investments Inc. and are used by Echelon Wealth Partners Inc. for information purposes only.
This report is is authored by Craig Basinger, Greg Taylor and Derek Benedet Purpose Investments Inc.
Insurance products and services are offered by life insurance licensed advisors through Chevron Wealth Preservation Inc., a wholly owned subsidiary of Echelon Wealth Partners Inc. This material is provided for general information and is not to be construed as an offer or solicitation for the sale or purchase of life insurance products or securities mentioned herein. Every effort has been made to compile this material from reliable sources however no warranty can be made as to its accuracy or completeness. Before acting on any of the above, please seek individual financial advice based on your personal circumstances. Please note that only Echelon Wealth Partners is a member of CIPF and regulated by IIROC; Chevron Wealth Preservation is not.
Forward-looking statements are based on current expectations, estimates, forecasts and projections based on beliefs and assumptions made by author. These statements involve risks and uncertainties and are not guarantees of future performance or results and no assurance can be given that these estimates and expectations will prove to have been correct, and actual outcomes and results may differ materially from what is expressed, implied or projected in such forward-looking statements.
The opinions expressed in this report are the opinions of the author and readers should not assume they reflect the opinions or recommendations of Echelon Wealth Partners Inc. or its affiliates. Assumptions, opinions and estimates constitute the author’s judgment as of the date of this material and are subject to change without notice. We do not warrant the completeness or accuracy of this material, and it should not be relied upon as such. Before acting on any recommendation, you should consider whether it is suitable for your particular circumstances and, if necessary, seek professional advice. Past performance is not indicative of future results. These estimates and expectations involve risks and uncertainties and are not guarantees of future performance or results and no assurance can be given that these estimates and expectations will prove to have been correct, and actual outcomes and results may differ materially from what is expressed, implied or projected in such forward-looking statements. Echelon Wealth Partners Inc. is a member of the Investment Industry Regulatory Organization of Canada and the Canadian Investor Protection Fund.
Share This Post


Call our office today for a private consultation about your Beyond Wealth needs.

Team Lairar
1565 Carling Avenue
Suite 600
Ottawa, Ontario
K1Z 8R1
LINKS
JOIN OUR MONTHLY NEWSLETTER
Contact Us


Please note that only Echelon Wealth Partners is a member of CIPF and regulated by IIROC; Chevron Wealth Preservation Inc. is not. *Insurance Products provided through Chevron Preservation Inc.