Does the Market Need to Drink to Have a Good Time?
If the punch bowl is stimulus, it is safe to say over the past number of years, the market has become rather hooked on this sweat-intoxicating elixir. QE, rate changes, and twists all had pretty big impacts on stock prices, both up and down. And this relationship arguably became even stronger following the pandemic, given the sheer amount of stimulus. From the go-go highs of 2021 on the back of an overflowing punch bowl to the pain in 2022 as the quantity of punch was slowly drawn down. But over the past month, the S&P broke to the upside as the aggregate amount of stimulus stabilized… or did it?
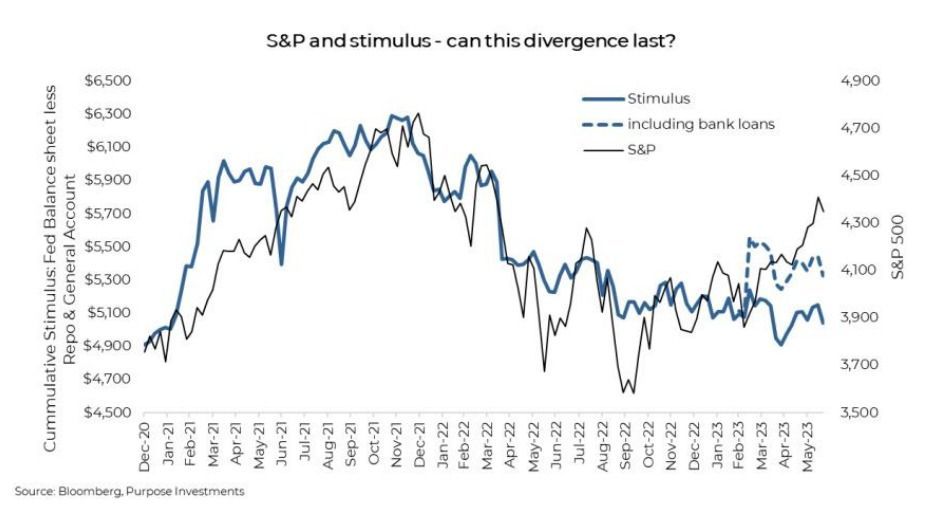
The above chart measures stimulus based on three inputs – the Fed balance sheet, the Repo market, and General Account (we will discuss the dashed line later). The size of the Fed’s balance sheet essentially measures quantitative easing or tightening as this results in changes in holdings for the Fed. If they buy bonds (QE), then it rises, and if they sell bonds (QT), holdings decrease. Remember, if the Fed buys a bond, what does the seller do with the money? If they go out and reinvest in other bonds or anything, that is a stimulus into the financial system. However, if they park it in the Repo market (depositing back at the Fed), well, the money has just gone in a circle. That is why the size of the Repo market is subtracted from the total stimulus.
This brings us to the General Account. The U.S. government’s chequebook is what they use to fund government spending. If this account increases, the government is holding onto money, and if it is reduced, they are spending. As a result, the size of the General Account is subtracted as well. With the previous debt ceiling issue, the General Account had been almost bled dry since new issuances were not approved. Now with the debt ceiling raised, the coffers are being replenished with increased Treasury issuance. This would result in falling stimulus – depending on where the money comes from.
If the Repo market is the source of funds to buy the new Treasuries being issued, there is no change to stimulus as this money was parked at the Fed anyhow, outside the financial system. If the money comes from elsewhere, it will be a reduction of aggregate stimulus, which is not good for markets, ignoring everything else. The partial good news so far is it appears the Repo market has been the source of most funds being absorbed by the General Account replenishment.
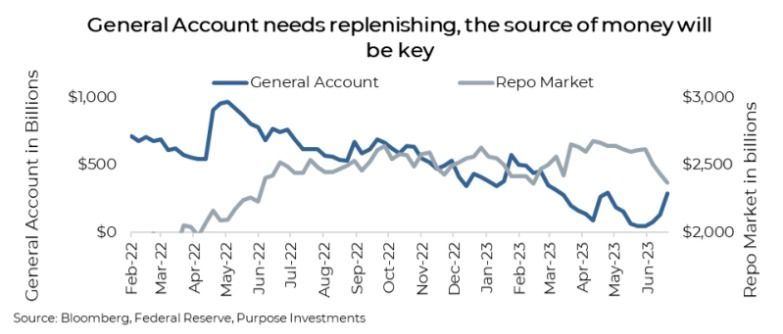
The chart below is scale normalized for the General Account and Repo market. As one fills up, the other is emptying. We would also point out that since the start of 2023, these two accounts have largely been offsetting one another. That is good news and also helps explain why the U.S. market has remained so resilient.
But, back to the first chart and the dashed line. When the regional banks started to come under pressure due to fleeing customer deposits, a couple of banks failed, and the Fed stepped in with a loan program. Banks could pledge bond holdings as collateral (valued at cost, not market), thus stop-gapping any liquidity concerns or need to realize losses due to customer pulling their deposits. We are not going further down this rabbit hole into the working of the U.S. financial system, as we would never finish our report on time. The key is this loan program could be viewed as a stimulus, but it is murky, given where the money goes. If it was the stimulus from the market’s perspective, it certainly helps explain this pop in equity prices beyond just AI hype.
Can the market dance sober?
If the trend in the punch bowl is in the direction of less punch, can the markets still go higher? Absolutely. But looking back over the past years of this quantitative monetarily influenced market, you can draw your own conclusion. The chart below is the Big 3 central bank balance sheets vs global equities. The circles are periods where it would appear the relationship has broken down. Red circles are periods when the stimulus was increasing, and markets still went down. Green circles are flat or less stimulus with an improving market.
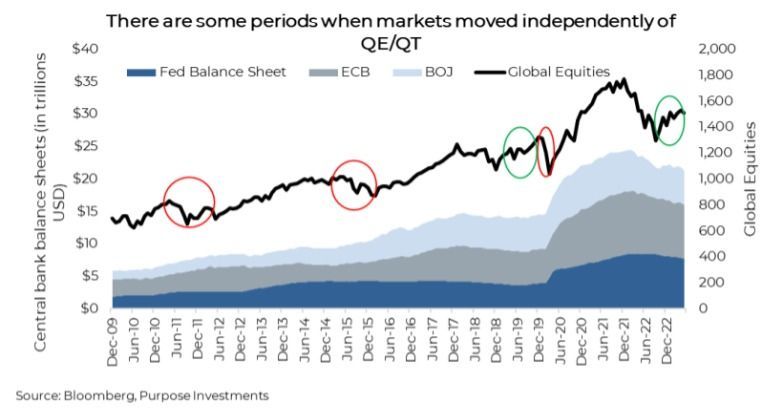
The circles actually line up with strong exogenous events impacting the market. For instance, in 2011, we were going through a European debt crisis while the U.S. debt was being downgraded. In 2015 it was a sudden slowdown in economic growth coming out of China. The good news is that green circle in 2019 was the first real run where the market appeared to be lifted by improving global economic activity. Skinny 2020 red circle was the mother of all shocks – Covid. And now we have 2023, the market is moving higher with stimulus flat to down.
Hard to support the recent bounce on an improving economy. Perhaps it is just the bounce from the big fall of 2022. Risky if this bounce is not supported by economic or stimulus.
Final Thoughts
Over the past month, the U.S. equity market has done well, as has Japan. After that, just about everyone is down. Maybe we can attribute the narrow lift to AI or a bit of residual stimulus coming off bank lending programs. But any way you cut it, the stimulus is being drawn down, which is a headwind for equity prices. Especially given a global economy that isn’t falling but certainly is not accelerating. Sober dancing rarely lasts long.
— Craig Basinger is the Chief Market Strategist at Purpose Investments
— Derek Benedet is a Portfolio Manager at Purpose Investments
Disclaimers
Source: Charts are sourced to Bloomberg L.P. and Purpose Investments Inc.
The contents of this publication were researched, written and produced by Purpose Investments Inc. and are used by Echelon Wealth Partners Inc. for information purposes only.
This report is authored by Craig Basinger, Chief Market Strategist, Purpose Investments Inc.
Insurance products and services are offered by life insurance licensed advisors through Chevron Wealth Preservation Inc., a wholly owned subsidiary of Echelon Wealth Partners Inc. This material is provided for general information and is not to be construed as an offer or solicitation for the sale or purchase of life insurance products or securities mentioned herein. Every effort has been made to compile this material from reliable sources however no warranty can be made as to its accuracy or completeness. Before acting on any of the above, please seek individual financial advice based on your personal circumstances. Please note that only Echelon Wealth Partners is a member of CIPF and regulated by IIROC; Chevron Wealth Preservation is not.
Forward-looking statements are based on current expectations, estimates, forecasts and projections based on beliefs and assumptions made by author. These statements involve risks and uncertainties and are not guarantees of future performance or results and no assurance can be given that these estimates and expectations will prove to have been correct, and actual outcomes and results may differ materially from what is expressed, implied or projected in such forward-looking statements.
The opinions expressed in this report are the opinions of the author and readers should not assume they reflect the opinions or recommendations of Echelon Wealth Partners Inc. or its affiliates. Assumptions, opinions and estimates constitute the author’s judgment as of the date of this material and are subject to change without notice. We do not warrant the completeness or accuracy of this material, and it should not be relied upon as such. Before acting on any recommendation, you should consider whether it is suitable for your particular circumstances and, if necessary, seek professional advice. Past performance is not indicative of future results. These estimates and expectations involve risks and uncertainties and are not guarantees of future performance or results and no assurance can be given that these estimates and expectations will prove to have been correct, and actual outcomes and results may differ materially from what is expressed, implied or projected in such forward-looking statements. Echelon Wealth Partners Inc. is a member of the Investment Industry Regulatory Organization of Canada and the Canadian Investor Protection Fund.
Share This Post

Call our office today for a private consultation about your Beyond Wealth needs.

Team Lairar
1565 Carling Avenue
Suite 600
Ottawa, Ontario
K1Z 8R1
LINKS
JOIN OUR MONTHLY NEWSLETTER
Contact Us


Please note that only Echelon Wealth Partners is a member of CIPF and regulated by IIROC; Chevron Wealth Preservation Inc. is not. *Insurance Products provided through Chevron Preservation Inc.