Markets Yield to Higher Yields
Not a very kind September so far: Equity markets are down so far in September, TSX -2%, S&P -4%, NASDAQ -6%, international -2%. And reminiscent of 2022, bonds are down too, Canadian bonds -2.4%, US broad bond universe -1.9%, with US investment grade -2.4% and High Yield -1.9%. Normally, when everything goes down together, portfolios are at least partially supported by a strong US dollar. And make no mistake, the US dollar is stronger by about 2% as measured by the trade-weighted dollar index. Unfortunately, with Canada’s higher inflation print a few days back, our dollar has been rising even faster. Pretty much the only thing up so far in September has been oil.

This may bring back some rather painful and still fresh memories from 2022. In case you forgot (and for this, I do apologize for bringing back these 2022 memories), stock and bond prices tended to move together – unfortunately, mostly in the down direction. The full year of 2022 finished with Canadian stocks down 6%, US stocks down 18% and Canadian bonds down 12%. Market performance of the past month or so may feel like the same dance, but there are some key differences.
Perhaps the biggest is which yields are moving. 2022 was especially painful because the risk-free rate or peak in expected Fed Funds Futures rose. In fact, up until recently, the equity market, as measured by the S&P 500, moved in the opposite direction of expected peak Fed Funds expectations. When peak Fed Funds expectations rose, the equity market fell and vice versa. Or, at the very least, the market would only move higher when peak rate expectations were stable. But since the S&P 500 peaked in early August, the weakness has not been associated with higher expectations of the peak Fed Funds rate, which has remained relatively stable at 5.45%.
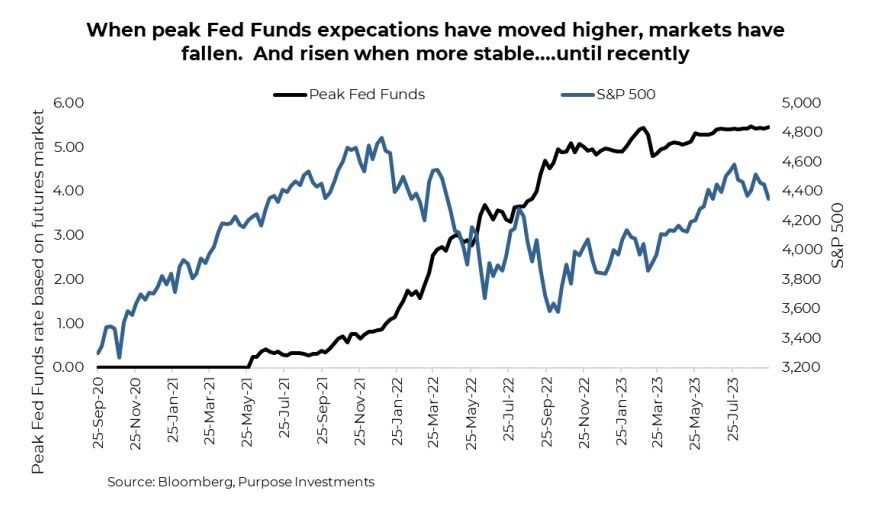
So then, what explains this recent bout of weakness for the S&P 500? It is rising yields but not at the shortest end (aka the peak Fed Funds rate). It is yields further out on the yield curve. Peak Fed Funds rate expectations have remained stable, but longer yields have moved higher, notably the 2-year or 10-year yields. Simultaneously, over the past month, the consensus forecast for the first rate cut has also been pushed out later, from March to June 2024. The higher-for-longer rates and yields have gained momentum. The 10-year US Treasury yield touched 4.5%, its highest level since 2007. Meanwhile, the less talked about 2-year yields touched 5.1%, its highest level since 2000.

Equity markets clearly do not like this move higher in yields, competing asset class, higher discount rates, and all that sort of stuff – even if it's just a 50-75bps move. So, what is moving yields higher?
There’s no denying the economic data has remained resilient or even better than consensus expectations in North America. Add to this some rekindling of inflation fears as some of the base effects that were helping inflation grind lower start to reverse. Maybe, but the data has been on the better side of consensus for a number of months. We continue to remain in the camp that slowing growth is coming as more of the savings buffer built up over the past few years is ground lower by inflation and higher credit costs. The number of cracks continues to grow, but truthfully, we did think they would have shown up sooner.
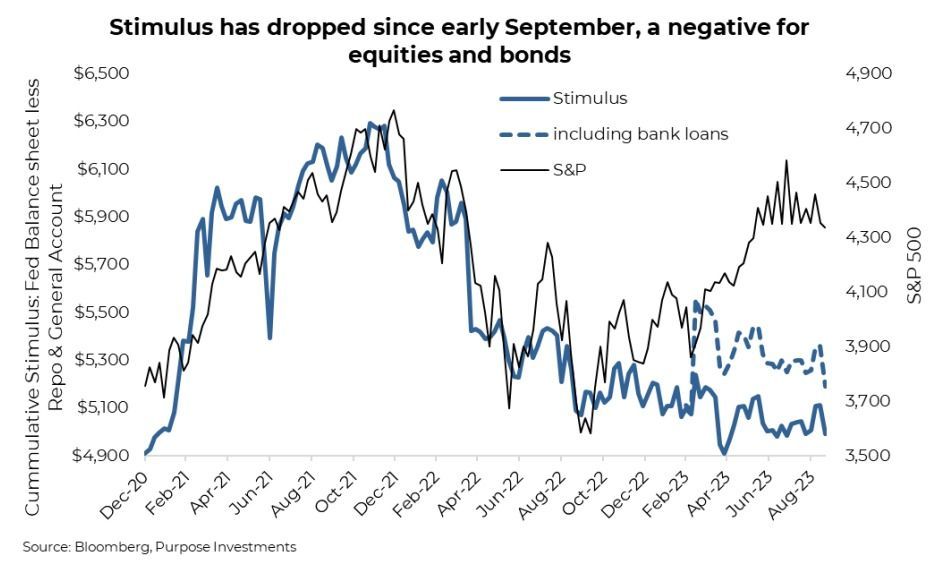
There is another factor that likely contributed to the recent up-move in yields, which has not been given much attention lately – good ol’ QT. Quantitative stimulus, or the removal of stimulus, has had a pretty big impact on equity and bond markets over the past decade. Now, the Fed has been slowly shrinking their accumulated balance sheet holdings. But there are other components of stimulus that have been more volatile, sloshing money around in the financial system. And those other categories have seen some big moves in September.
The General Account, akin to the government chequing account, had been filling up after the previous debt ceiling drama. Filling up is removing stimulus from the markets, and it accelerated in the past week. Maybe due to renewed shenanigans around the debt ceiling and with quarterly corporate tax receipts incoming. Nonetheless, this is less stimulus. Much of the general account replenishment had been offset by a reduction in the REPO market holdings [call us if you want more details]. For much of the past few months, this neutralized the impact of the rising General Account, but recently, the increase in the general account has been much, much larger than the reduction in REPO. Net result: less stimulus.
Another factor has been the Bank Term Funding Program and Other Credit Extensions. These were the Fed accounts that regional banks tapped when they were under pressure due to deposit outflows. Remember that scare back in March? This tapping was a stimulus, and it ballooned quickly but recently has started to come down quickly. Hence the removal of stimulus.
Final Thoughts
Don’t worry; the market doesn’t need to match the stimulus line in our chart, as that is a rather large gap. But directionally, there is a connection. With less stimulus ahead, this will remain a headwind for markets, both equities and bonds. For bonds, this may be creating an opportunity, lower price / higher yield. If we are correct that slower growth and recession risk will rise in the coming months, those yields will likely see some downward pressure (prices higher). That may prove good news for equities, too, for a bit. Until the recession fears growth larger and earnings growth becomes something else for us to Ethos about.
— Craig Basinger is the Chief Market Strategist at Purpose Investments
— Special contribution from Michael Allen at Purpose Investments
Disclaimers
Source: Charts are sourced to Bloomberg L.P. and Purpose Investments Inc.
The contents of this publication were researched, written and produced by Purpose Investments Inc. and are used by Echelon Wealth Partners Inc. for information purposes only.
This report is authored by Craig Basinger, Chief Market Strategist, Purpose Investments Inc.
Insurance products and services are offered by life insurance licensed advisors through Chevron Wealth Preservation Inc., a wholly owned subsidiary of Echelon Wealth Partners Inc. This material is provided for general information and is not to be construed as an offer or solicitation for the sale or purchase of life insurance products or securities mentioned herein. Every effort has been made to compile this material from reliable sources however no warranty can be made as to its accuracy or completeness. Before acting on any of the above, please seek individual financial advice based on your personal circumstances. Please note that only Echelon Wealth Partners is a member of CIPF and regulated by IIROC; Chevron Wealth Preservation is not.
Forward-looking statements are based on current expectations, estimates, forecasts and projections based on beliefs and assumptions made by author. These statements involve risks and uncertainties and are not guarantees of future performance or results and no assurance can be given that these estimates and expectations will prove to have been correct, and actual outcomes and results may differ materially from what is expressed, implied or projected in such forward-looking statements.
The opinions expressed in this report are the opinions of the author and readers should not assume they reflect the opinions or recommendations of Echelon Wealth Partners Inc. or its affiliates. Assumptions, opinions and estimates constitute the author’s judgment as of the date of this material and are subject to change without notice. We do not warrant the completeness or accuracy of this material, and it should not be relied upon as such. Before acting on any recommendation, you should consider whether it is suitable for your particular circumstances and, if necessary, seek professional advice. Past performance is not indicative of future results. These estimates and expectations involve risks and uncertainties and are not guarantees of future performance or results and no assurance can be given that these estimates and expectations will prove to have been correct, and actual outcomes and results may differ materially from what is expressed, implied or projected in such forward-looking statements. Echelon Wealth Partners Inc. is a member of the Investment Industry Regulatory Organization of Canada and the Canadian Investor Protection Fund.
Share This Post


Call our office today for a private consultation about your Beyond Wealth needs.

Team Lairar
1565 Carling Avenue
Suite 600
Ottawa, Ontario
K1Z 8R1
LINKS
JOIN OUR MONTHLY NEWSLETTER
Contact Us


Please note that only Echelon Wealth Partners is a member of CIPF and regulated by IIROC; Chevron Wealth Preservation Inc. is not. *Insurance Products provided through Chevron Preservation Inc.