Butterflies
One would think that with CPI rising, the Fed hiking rates by 75bps, the Bank of Canada hiking even higher by 100bps, the U.S.
GDP posting a second consecutive quarter of negative growth, and the recession chorus growing louder, things are looking dire.
Yet markets have rallied this month, reinforcing the fact that the market’s starting point matters just as much as the news flow. After a terrible June, the TSX has advanced +4.7%, S&P 9.2%, and Nasdaq by +12.4% in July. Meanwhile, bond yields have dropped on recession fears. While many have complained of the positive correlation between equities and bonds this year, temporarily reducing the efficacy of portfolio construction, positive correlation is rather nice when everything goes up.

Authors from Purpose Investments:
Craig Basinger ~ Chief Market Strategist
Derek Benedet ~ Portfolio Manager
Brett Gustafson ~ Portfolio Analyst
Two charts that explain just about everything
If a butterfly flaps its wings in Africa, it can cause rain on the other side of the world, say in Toronto. Yes, we
are misquoting a common misquote about chaos theory. But the lesson is a small change (the butterfly) in
a dynamic complex system (weather) can result in huge differences in outcomes over time.
Let’s say the butterfly (…perhaps Mothra) is the pandemic, and instead of the butterfly’s affect on weather,
we are watching “the butterfly effect” reverberate through the economy, our behaviors, and the markets. The
pandemic was an exogeneous shock to the entire system—it changed behaviors, economic relationships,
moods, etc. Now things will return to normal, but the impacts will continue to reverberate through the
system for years, likely with a diminishing magnitude. (Okay, pebble in a pond may have been a better analogy but I’m now pot committed.)
We think the following two charts can help explain just about everything: how the pandemic changed
behaviors in one direction and then another, which has caused everything from a +25% year, -20% half year,
global growth, now slowdown, inflation, central bank policies, and even why you can’t fly with your luggage
or get a reasonable reservation at a fancy restaurant.

We are referencing U.S. consumer data in these charts, but the pattern is similar in many developed
economies. Let’s start with the left chart—this shows U.S. consumer spending on goods or simply stuff. Cars,
iPads, renovating our homes to make them more comfortable, etc. When the pandemic hits, many began
working remote, travel slowed, going out to dinner slowed—this was the initial behaviour response. All that
income saved from not going to Six Flags or Le Bernardin (i.e., money spent on services) was instead piled
into stuff (goods). Goods spending has a bigger impact on both the overall economic activity and
corporate earnings.
Goods spending generally follows a steady growth path, with a dip down in recessions: you can see this in the left chart's drop in 2008; then, as the economy recovers, the line resumes its upward path. The pandemic sent this line parabolic, with an extra trillion dollars being spent on stuff. Even if supply chains were not impeded by pandemic issues, the economy has a hard time adjusting to such an abnormal shift in
demand.
So corporate profits soar and so does the economy. Companies clamored to expand capacity to meet demand and hired lots of people quickly—probably too quickly, as the passage of time will likely tell. We are not downplaying the contribution of stimulus, but changing behaviour is bigger. Put all this into the mix and
markets rock higher.
Now the wave of behaviour has started to change direction. We don’t need a new RV, the one in the
driveway is only a year old. Instead, we want to go out and do things again, demanding more
services (refer to the chart on right). And we are willing to pay for it because after sitting around the same
town for two years, the travel itch is strong (revenge travel). Yet this sudden demand for travel and services is running into capacity issues. Not the same as manufacturing bottlenecks, more due to soft demand for many services for a couple years led to less capacity. Now with demand back, capacity takes time to adjust.
Add all this up, we have inflation, wage pressure, and not enough baggage handlers. Capacity in services will
rise to meet demand but it takes time. Similarly, manufacturing is steadily catching up with the sudden rise in demand for goods.
These are big waves that are moving through the system, economy, and market and all caused by the
exogenous shock of the pandemic in 2020. The waves cause imbalances and distortions, turning historical
norms upside down. In fact, if service spending continues while goods spending rolls over, we could
very well have a recession or earnings recession with employment still rising.
We are not downplaying central bank policy as a big driver but would say central bankers are reacting to these waves just like the rest of us. We live in interesting times.
Dividend stocks ready for their moment
It’s been a difficult year for investors so far, with central bankers battling inflation, and recession fears
dominating news flow. Not to mention, typical diversifiers have not been providing the type of protection
investors have come to expect. Forty years of declining bond yields, particularly during times of volatility,
tend to entrench certain expectations. This is the way stocks and bonds are ‘supposed’ to work together, and
then there is the 2022 way.
When it comes to portfolio construction, the stock-to-bond asset mix tends to dominate asset-allocation
discussions. Within equities, geographic and factor diversification gets a lot of attention as well. Value,
growth, and momentum are much better understood by the average investor compared with a decade ago. Dividend stocks tend lean more towards value compared with the growth factor, but there is a full spectrum
from those that are more growth sensitive (cyclical yield) to traditional safe havens (utilities and staples). The group as a whole has offered investors attractive relative returns while offering a larger degree of inflation protection and much needed portfolio stability.
Dividend-paying stocks help meet a wide variety of investment objectives, chiefly the search for yield.
Though they are not as glamourous as disruptive tech, over the long term, dividend income when reinvested
offers attractive compounding effects—specifically, over the past 30 years, the annualized price return for the S&P/TSX Composite was 5.9%, compared with 8.4% in total return including dividends. Over the even
longer term, dividends account for well over half of the markets total return.
Increases portfolio stability without sacrificing returns
Volatility has been at the forefront of the markets so far this year. The VIX has been above 20 for all but a
handful of days in 2022. Dividend stocks have historically performed well in choppy markets, but also do well as a standalone portion of a portfolio. Since 1998, the DJ Cdn Dividends Index has not only outperformed
the TSX, but it has done so with a lower standard deviation and lower downside deviation.New Paragraph

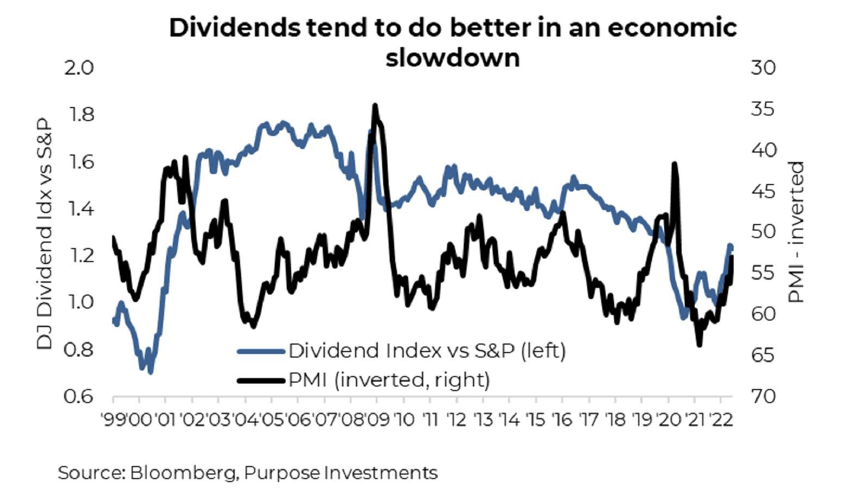
Regardless of whether or not a recession manifests, dividend stocks tend to be more stable during periods of weakening economic growth. The chart below plots the ratio of DJ US Select Dividend Index to the S&P 500 along with the ISM Manufacturing PMI data inverted. When the economy is slowing there is plenty of
anxiety, and dividend stocks can be like a Xanax for your portfolio. They can smooth out the highs and lows,
adding further portfolio resiliency. In bear markets, a resilient portfolio is exactly what most investors should
strive for.
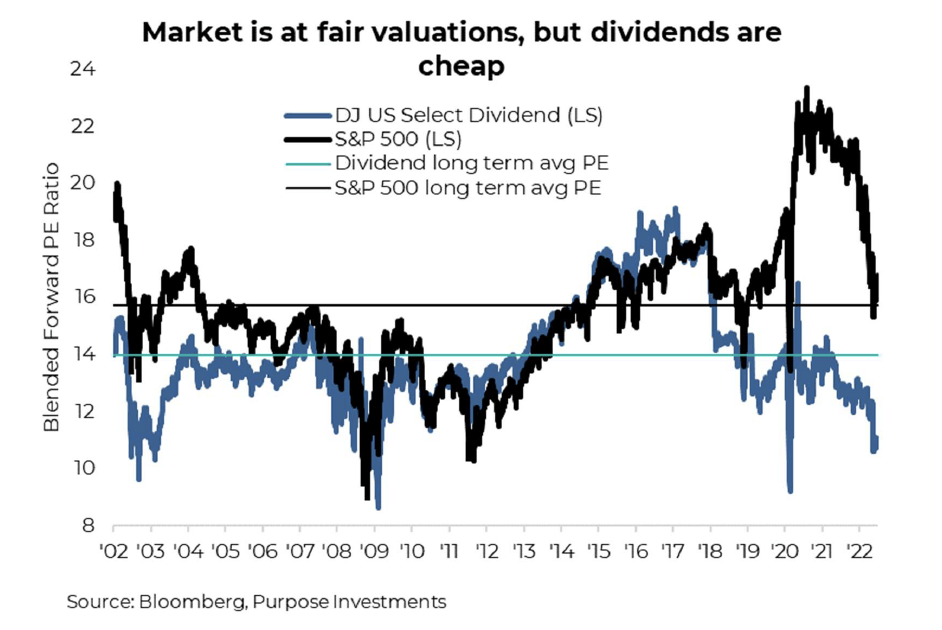
Attractive valuations
Despite a solid start to the year, valuations are still attractive for dividend-paying stocks, especially in the U.S. They still trade at a solid discount based on price to earnings. Despite the bear market, the broader U.S.
market is only now just trading in line with its longer-term average valuations, while dividend stocks are
trading closer to prior troughs.
Added diversification – especially with an active touch
Depending on the market environment, certain sectors outperform, while others struggle. It’s just how the
normal market cycle tends to work. So far this year, the difference between the best and worst sectors in
Canada is about 85%. Sector disparity is massive, and as such, proper diversification is essential.
This is where it gets a little problematic.
The Canadian market is rather poorly constructed: it has big weights in Financials and Energy. The U.S. is a
bit better but has an outsized allocation to Technology. Dividend-focused indexes help fix some allocations
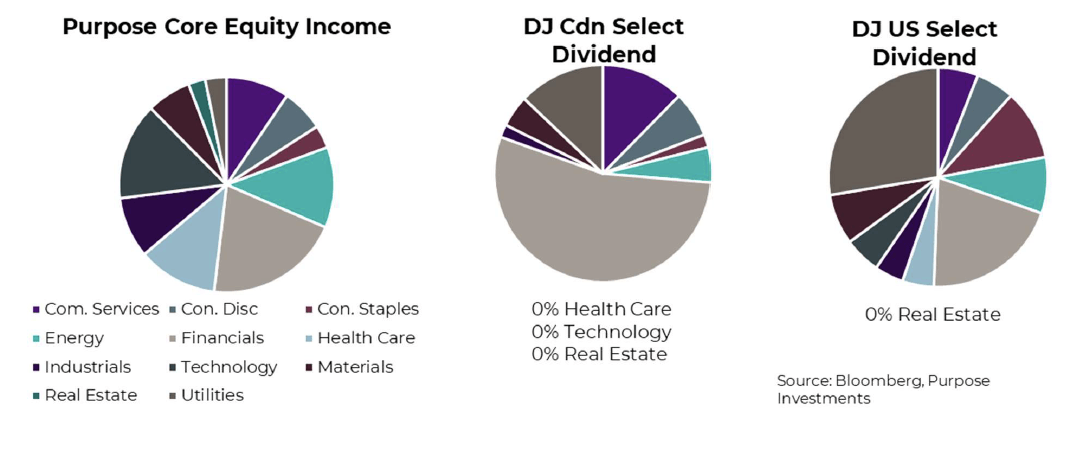
but tend to worsen others. From the charts below, you can see that the specific Dow Jones Dividend Index
for both Canada and the U.S. have rather large concentrations in certain sectors. In Canada, concentrations in Financials jump to over 50%, and in the U.S., Utilities move to nearly 28%. In comparison, we’ve added the
allocations of the Purpose Core Equity Income Fund (RDE) as well.
Adding an active touch to the portfolio management process is a great way to increase diversification.
Compared with many other static ETFs, active portfolio managers can tactically shift sector weights to
position portfolios for different market environments. Also, unlike many other rules-driven funds, they are
not narrowly confined to just high-dividend payers or long-term growers like certain aristocratic ETFs. High
yields are not always an indicator of financial health.
Sustainability is very important, and a company that is paying out too much may inhibit the longer-term
financial health of the company. Likewise, only focusing on dividend growers with a long history of growth
would tend to eliminate new entrants into the dividend universe and focus too much on older mature
companies. When choosing a dividend fund, we’d recommend one that is actively managed, that
blends quantitative screens with experienced oversight that can deliver the best of both worlds. Tilt
towards higher-quality stable companies at times and focus on more cyclical dividend payers when the time is right.
Market cycle still softening
There is no denying, the economic data continues to worsen, just look at the U.S. Q2 GDP print! We can
blame foreign trade in Q1 or inventories in both Q1 & Q2, for triggering two back-to-back negative GDP
readings. But make no mistake things are slowing down across the board including the consumer and
business spending. Yes, the employment market remains strong, but make no mistake employment is a
lagging indicator. Companies cut back on incidental spending first, then investment and then labour. Good
people are hard to find and even shitty people are expensive to fire. This normal order was flipped around in
2020 due to the abrupt shutdown of many services created a ‘recession’ that had employment as a
coincidental or leading the broader weakness. That was an anomaly, this pattern is more normal.
Slowing economic growth isn’t great, but a normal pattern is welcome after two years of abnormal. Tighter
financial conditions are hitting the interest rate sensitive industries, which is spreading. And this slower
growth continues to soften fears of inflation.
Is the U.S. economy in a recession? Two back-to-back quarters of negative GDP fits the rule of thumb for
a recession, but the odd gyrations still washing through the economy have made many rules of thumb less
useful over the past few years. We could wait for the official word on recession from the National Bureau of
Economic Research, but we would likely have to wait till the recession is over. They tend to be tardy.
We don’t think the U.S. is in a recession at the moment but the odds continue to rise. Plus, the data is only
going to continue to soften in the months ahead, so the recession talk will continue to grow louder. This
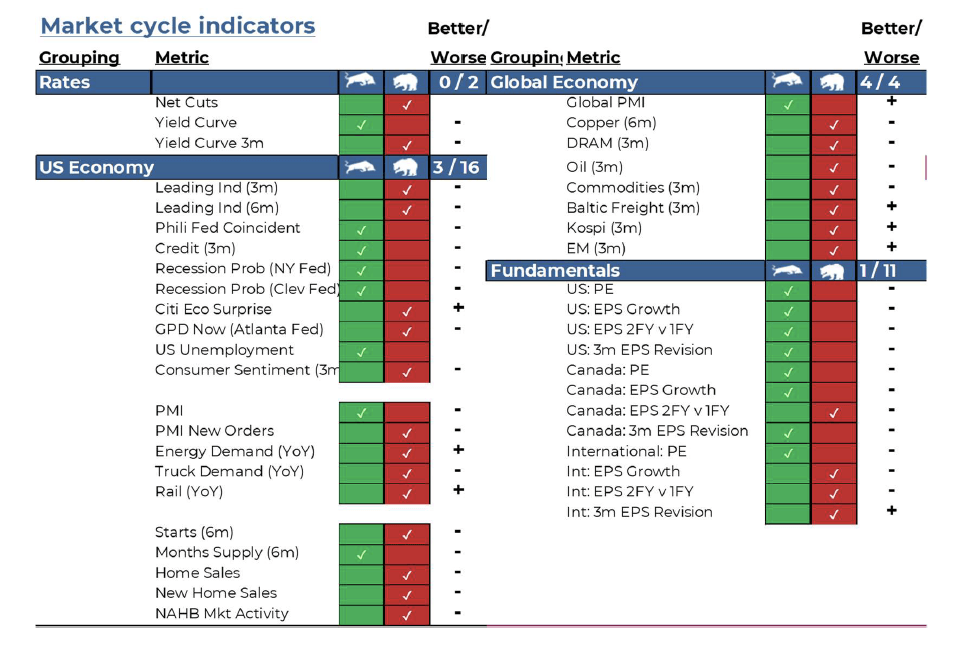
deterioration continues to be evident in our Market Cycle indicators, which dropped significantly in June and
continued to soften a bit in July.
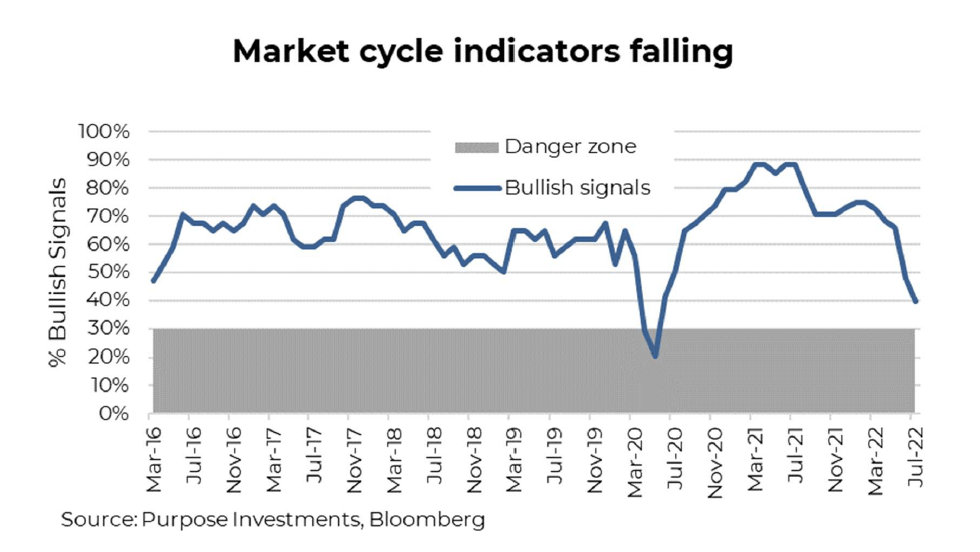
The bad news or soft spots have remained. This includes the global economy, with six of seven signals in the bearish camp. The U.S. economy remains on a stronger footing but that is softening as well, with notable
weakness in housing and now manufacturing. Fundamentals have also started to show weakness as earnings
revisions are increasingly negative.
It is even a bit worse than the chart above portrays. In addition to whether a signal is bullish or bearish, we
track the direction of the indicator. Is it getting better or worse, improving or deteriorating? There are a lot
more signals that continue to get worse vs better, as we would expect given the overall tide of data. While it
may be a bit early to celebrate, the global economic data has a number of indicators starting to improve.
Aggregate demand is slowing, which is alleviating inflationary pressures. This is literally what is
needed to keep inflation expectations from becoming entrenched, which would be a bigger, longerterm
issue. Will the slowing economy lead to a recession? Maybe. But it’s worth noting this is still more
adjustment-oriented, following the pandemic waves. There are few pockets of excess in the economy, which
is good. Banks are well capitalized, so not a 2008 kind of thing. Valuations have been knocked down already,
so maybe not even a 2001 kind of market. Maybe more akin to 1994, rapid tightening of financial conditions
led to equity and bond market weakness, plus softening of the economy. This re-pricing did set the stages for better times ahead.
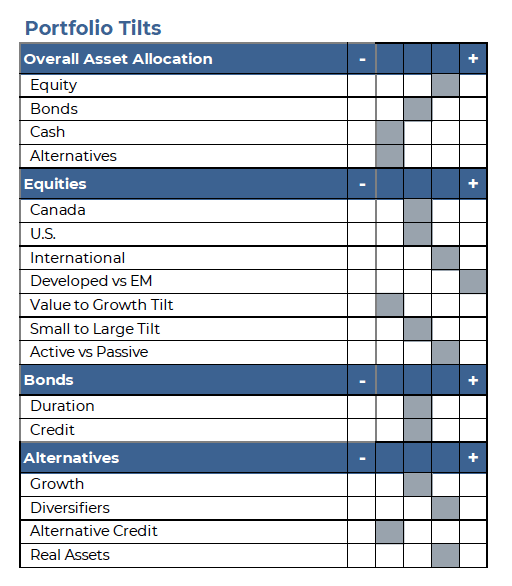
Portfolio Construction
We’ve made no changes to our portfolio positioning since last month. Our move to neutral bond allocations has worked out well as recession risk rises. And while it may seem counter intuitive to remain overweight equities, given the market drop this year a lot of bad news is priced in. And if inflation fears continue to recede, there could be an extended reprieve.
Among equities, we have become more positive on markets that have normally weathered traditional economic slowdowns better, including the U.S. and Japan.
The second half of 2022 will not be smooth sailing, as changing behaviours will continue to reverberate through the economy and the markets. However, given more reasonable bond yields and prices in the equity market, our return expectations for the balance of 2022 are positive.
— Craig Basinger is the Chief Market Strategist at Purpose Investments
— Derek Benedet is a Portfolio Manager at Purpose Investments
— Brett Gustafson is a Portfolio Analyst at Purpose Investments
Source: Charts are sourced to Bloomberg L.P. and Purpose Investments Inc.
The contents of this publication were researched, written and produced by Purpose Investments Inc. and are used by Echelon Wealth Partners Inc. for information purposes only.
This report is authored by Craig Basinger, Greg Taylor and Derek Benedet Purpose Investments Inc.
Insurance products and services are offered by life insurance licensed advisors through Chevron Wealth Preservation Inc., a wholly owned subsidiary of Echelon Wealth Partners Inc. This material is provided for general information and is not to be construed as an offer or solicitation for the sale or purchase of life insurance products or securities mentioned herein. Every effort has been made to compile this material from reliable sources however no warranty can be made as to its accuracy or completeness. Before acting on any of the above, please seek individual financial advice based on your personal circumstances. Please note that only Echelon Wealth Partners is a member of CIPF and regulated by IIROC; Chevron Wealth Preservation is not.
Forward-looking statements are based on current expectations, estimates, forecasts and projections based on beliefs and assumptions made by author. These statements involve risks and uncertainties and are not guarantees of future performance or results and no assurance can be given that these estimates and expectations will prove to have been correct, and actual outcomes and results may differ materially from what is expressed, implied or projected in such forward-looking statements.
The opinions expressed in this report are the opinions of the author and readers should not assume they reflect the opinions or recommendations of Echelon Wealth Partners Inc. or its affiliates. Assumptions, opinions and estimates constitute the author’s judgment as of the date of this material and are subject to change without notice. We do not warrant the completeness or accuracy of this material, and it should not be relied upon as such. Before acting on any recommendation, you should consider whether it is suitable for your particular circumstances and, if necessary, seek professional advice. Past performance is not indicative of future results. These estimates and expectations involve risks and uncertainties and are not guarantees of future performance or results and no assurance can be given that these estimates and expectations will prove to have been correct, and actual outcomes and results may differ materially from what is expressed, implied or projected in such forward-looking statements. Echelon Wealth Partners Inc. is a member of the Investment Industry Regulatory Organization of Canada and the Canadian Investor Protection Fund.
Share This Post

Call our office today for a private consultation about your Beyond Wealth needs.

Team Lairar
1565 Carling Avenue
Suite 600
Ottawa, Ontario
K1Z 8R1
LINKS
JOIN OUR MONTHLY NEWSLETTER
Contact Us


Please note that only Echelon Wealth Partners is a member of CIPF and regulated by IIROC; Chevron Wealth Preservation Inc. is not. *Insurance Products provided through Chevron Preservation Inc.