Do Valuations Matter?
One could certainly question the importance of valuations in this market. If you were bold enough to buy Nvidia a year ago, ignoring the 60x price-to-earnings (forward earnings), you made money. Microsoft, too, sits at 33x and continues to go up even though its forecast earnings growth is only about 15%. Or which pharmaceutical company would you like to own, the one trading at 50x earnings or 12x? Surprisingly, the right answer was the 50x Lily and not the 12x Pfizer. Solving for a pandemic is nice, but solving for fat is much more lucrative.
For the S&P 500, the quartile of companies that were trading with the lowest valuation at the start of 2023 enjoyed an average return of 8.9%. Not bad. But the companies with the highest valuations returned 17.7%. It's not just within U.S. equities that it may appear valuation doesn’t matter. Emerging markets have been trading at very low valuations for years and have consistently lagged developed markets. Based on the Bloomberg Developed (DM) and Emerging (EM) markets indices, the spread is wide at about 18x vs 12x. Also of interest is that EM earnings are expected to grow at 28% compared to 18% in DM over the next couple of years. Or the TSX at 14x compared to 20x for the S&P, a long-standing valuation spread, yet the more expensive S&P keeps winning.
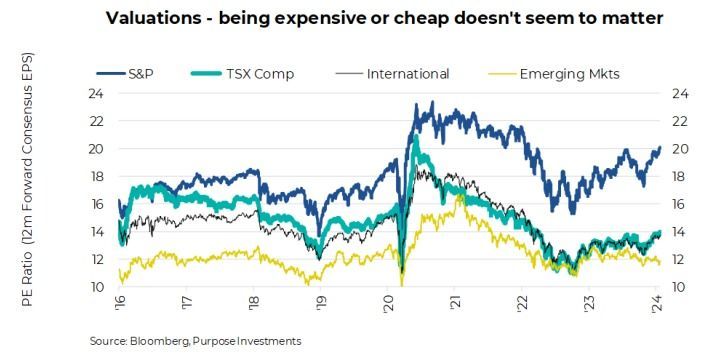
Now, comparing one market's valuations to another is like comparing apples and oranges. The composition of the market and different sector weights can often explain much divergence in valuations. For instance, the S&P currently has a 30% weight in technology, often a higher multiple sector. That compares to under 10% for the TSX. The S&P has more consumer staples, more health care, less energy, and less financials compared to the TSX. Staples and health typically carry higher valuations than the more cyclical energy and financials.
Yet valuations do matter. The chart below uses S&P 500 data back to 1950 and calculates the average performance for the S&P 500 based on starting point valuations. It is rather clear that higher valuations equate to lower returns going forward, on average. And that is the crux: averages can hide a lot of data. Sure, the average return from a starting point in the most expensive quartile bucket is rather close to zero, yet the one-year return ranges from +39% to -38%. That is rather wide. The 3-year return ranges from -17% to +18%. So, even though valuations are high, anything can happen.
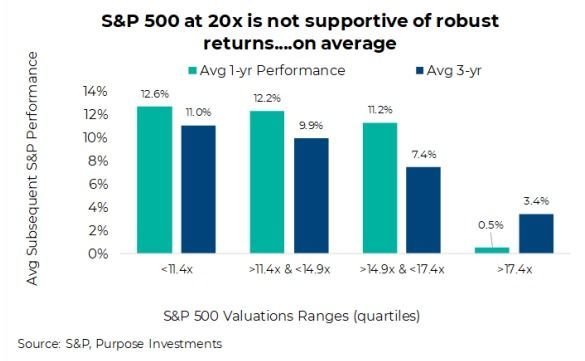
Worth noting, the range of performance outcomes when the starting point is cheap (less than 11.4x), are rather compelling. The 3-year annualized worse case was flat, and the best case was +26%. Today, though, we are not in the bargain basement; we are in the valuation luxury penthouse.
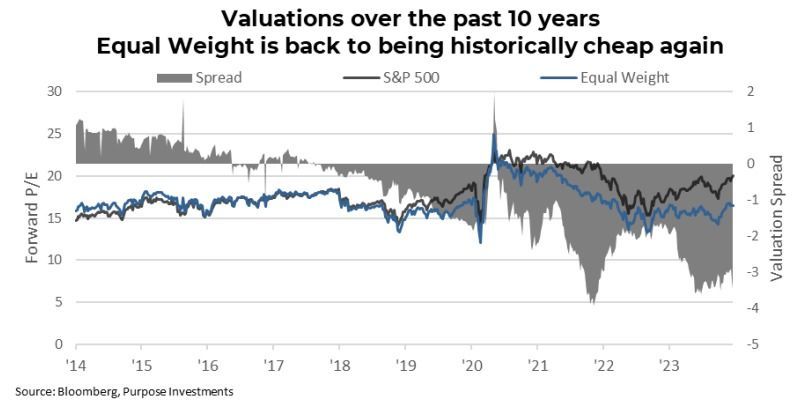
Pushing the S&P 500 up to the penthouse of valuations is the Mag 7 or Enormous 8, or whichever funny label you prefer for the megacaps sitting atop the index. The concentration in the S&P 500 is at or near historically high levels, which is also pushing the valuation to the upper levels. To give an idea, the chart below shows the relative valuations of the S&P 500 (traditional market capitalization-weighted version) and the Equal Weight S&P 500 index. It is those megacaps making the S&P 500 expensive; the broader market is not nearly as elevated.
Final Thoughts
The Enormous 8 could very easily become more enormous in 2024, which would once again drive the most expensive part of the market higher. The average PE across the Enormous 8 is currently 36x forward earnings, but as we learned in 2023, a high starting valuation doesn’t guarantee anything as, in the short term, anything is possible. However, given concentration and given valuations, the odds are likely tilted in the other direction. Don’t lose sight of valuations; in the long run, they are one of the best indicators of performance and can offer a margin of safety.
— Craig Basinger is the Chief Market Strategist at Purpose Investments
Disclaimers
Source: Charts are sourced to Bloomberg L.P. and Purpose Investments Inc.
The contents of this publication were researched, written and produced by Purpose Investments Inc. and are used by Echelon Wealth Partners Inc. for information purposes only.
This report is is authored by Craig Basinger, Greg Taylor and Derek Benedet Purpose Investments Inc.
Insurance products and services are offered by life insurance licensed advisors through Chevron Wealth Preservation Inc., a wholly owned subsidiary of Echelon Wealth Partners Inc. This material is provided for general information and is not to be construed as an offer or solicitation for the sale or purchase of life insurance products or securities mentioned herein. Every effort has been made to compile this material from reliable sources however no warranty can be made as to its accuracy or completeness. Before acting on any of the above, please seek individual financial advice based on your personal circumstances. Please note that only Echelon Wealth Partners is a member of CIPF and regulated by IIROC; Chevron Wealth Preservation is not.
Forward-looking statements are based on current expectations, estimates, forecasts and projections based on beliefs and assumptions made by author. These statements involve risks and uncertainties and are not guarantees of future performance or results and no assurance can be given that these estimates and expectations will prove to have been correct, and actual outcomes and results may differ materially from what is expressed, implied or projected in such forward-looking statements.
The opinions expressed in this report are the opinions of the author and readers should not assume they reflect the opinions or recommendations of Echelon Wealth Partners Inc. or its affiliates. Assumptions, opinions and estimates constitute the author’s judgment as of the date of this material and are subject to change without notice. We do not warrant the completeness or accuracy of this material, and it should not be relied upon as such. Before acting on any recommendation, you should consider whether it is suitable for your particular circumstances and, if necessary, seek professional advice. Past performance is not indicative of future results. These estimates and expectations involve risks and uncertainties and are not guarantees of future performance or results and no assurance can be given that these estimates and expectations will prove to have been correct, and actual outcomes and results may differ materially from what is expressed, implied or projected in such forward-looking statements. Echelon Wealth Partners Inc. is a member of the Investment Industry Regulatory Organization of Canada and the Canadian Investor Protection Fund.
Share This Post
Call our office today for a private consultation about your Beyond Wealth needs.

Team Lairar
1565 Carling Avenue
Suite 600
Ottawa, Ontario
K1Z 8R1
LINKS
JOIN OUR MONTHLY NEWSLETTER
Contact Us


Please note that only Echelon Wealth Partners is a member of CIPF and regulated by IIROC; Chevron Wealth Preservation Inc. is not. *Insurance Products provided through Chevron Preservation Inc.