Buy the Dip or Sell the Tip?
Looks like we're closer to a deal. Markets are pleased that a debt ceiling appears to be within reach, avoiding all the potentially bad stuff that this politically motivated crisis could have unleashed. Certainly, good news, and this has lifted equities higher – dare we say, without jinxing it, the S&P is peaking above the upper range of the past six months.

So, all smooth sailing from here? We continue to view this as an extended relief rally but certainly acknowledge the resilience of this advance. From the bottom at the end of Q3 ’22, global equities are up +17%, US +16%, EAFE +29%, with Canada lagging at +12%. If you ranked this positive performance, it would be an exact mirror of the poor performance during the sell-off in ’22. Canada fell the least during weakness and is bouncing back the least. Nasdaq fell the most and is bouncing back the most.
Over much of the past decade, the strategy of buy the dip has become the mantra of many. This was obviously not the ideal strategy for the first nine months of 2022 until the October low. Since then, it has been working once again as the market softened in late December to bounce higher, then weakened in March to bounce higher. To be fair, selling the tip has worked, too, from the mini peaks in November, February and perhaps now…
We lean more towards selling the tip – perhaps trimming the tip is more accurate. And we have got valuations on the side. The move higher in the S&P on the back of pretty muted earnings has pushed the forward price-to-earnings ratio up to 18.5. By comparison, it was down to 15 last Fall. This puts S&P 500 valuations well into the most expensive quartile grouping based on data back to the 1950s. And on average, this bucket is followed by pretty muted market returns for the index.
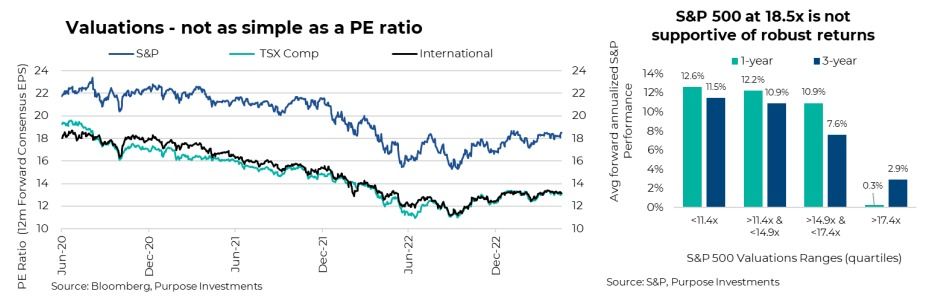
Price to earnings is a very useful valuation metric but life and investing is never that simple. Here are a few other aspects to consider, most of which support our trimming of the tip mindset.
Yields – There is a relationship between equity market valuations and yields available in the bond market. Bonds are a competing asset class, and, everything else being equal, higher yields attract capital. To counter this, equity markets tend to offer lower valuations. Since lower valuations are associated with higher average forward returns, this balances with the higher yield/returns in the bond market.
When yields were below 2%, that was more supportive of higher equity market valuations. Today, with 10-year Treasury yields at 3.7%, we would say this is less supportive of higher equity market valuations. Cash, too, if you can pick up 4-5% with no risk, the expected return in the equity market has to be higher to compensate. Not sure 18.5x for the S&P fits into that framework.
Earnings growth - Price to earnings is a snapshot of valuations, and both the P and E can change. On occasion, when earnings are depressed and/or earnings are expected to grow rapidly, this supports higher valuations. Often the term used is the market will grow into its current valuation. Consensus estimates have the S&P 500 earning about $210 in 2023, which would be a record high. So clearly, earnings are not depressed.
So will earning growth be robust? We are not optimistic. Margins had remained high for many quarters but are now starting to come under pressure. Sales growth is slowing as the economy slows and inflation cools. Meanwhile, costs are still rising from wages to the impact of higher rates. Even if you don’t believe a recession is coming, you probably agree that the economy is set to slow.
Earnings quality - $1 does not equal $1 when it comes to earnings. $1 of earnings from a cyclical company, such as an energy producer or $1 from a levered financial, is not as valuable from the market’s perspective as $1 from a more stable source. Consumer Discretionary earnings are worth less than more stable Consumer Staples. This helps explain the persistent valuation gap between markets such as the TSX and S&P.
On a relative basis, the TSX has a higher weighting in many sectors that simply carry less value per dollar of earnings. And today, a larger portion than average is coming from these same sectors. To show the higher variability of fundamentals, the chart below is the R squared of a number of metrics. If these grew steadily over time, the R squared would be 1, so the further the reading from 1, the more volatile.

Final Thoughts
Even with lower quality of earnings for the TSX and international markets, the valuation gap more than makes up for it compared to the U.S. market. We continue to believe on a relative basis, and we are more comfortable with Canadian dividend-tilted equities or deeper value among international equities such as Europe and Japan.
On a shorter-term basis, maybe we will buy the dip when it comes, but for now, we would rather sell the tip.
— Craig Basinger is the Chief Market Strategist at Purpose Investments
Disclaimers
Source: Charts are sourced to Bloomberg L.P. and Purpose Investments Inc.
The contents of this publication were researched, written and produced by Purpose Investments Inc. and are used by Echelon Wealth Partners Inc. for information purposes only.
This report is authored by Craig Basinger, Chief Market Strategist Purpose Investments Inc.
Insurance products and services are offered by life insurance licensed advisors through Chevron Wealth Preservation Inc., a wholly owned subsidiary of Echelon Wealth Partners Inc. This material is provided for general information and is not to be construed as an offer or solicitation for the sale or purchase of life insurance products or securities mentioned herein. Every effort has been made to compile this material from reliable sources however no warranty can be made as to its accuracy or completeness. Before acting on any of the above, please seek individual financial advice based on your personal circumstances. Please note that only Echelon Wealth Partners is a member of CIPF and regulated by IIROC; Chevron Wealth Preservation is not.
Forward-looking statements are based on current expectations, estimates, forecasts and projections based on beliefs and assumptions made by author. These statements involve risks and uncertainties and are not guarantees of future performance or results and no assurance can be given that these estimates and expectations will prove to have been correct, and actual outcomes and results may differ materially from what is expressed, implied or projected in such forward-looking statements.
The opinions expressed in this report are the opinions of the author and readers should not assume they reflect the opinions or recommendations of Echelon Wealth Partners Inc. or its affiliates. Assumptions, opinions and estimates constitute the author’s judgment as of the date of this material and are subject to change without notice. We do not warrant the completeness or accuracy of this material, and it should not be relied upon as such. Before acting on any recommendation, you should consider whether it is suitable for your particular circumstances and, if necessary, seek professional advice. Past performance is not indicative of future results. These estimates and expectations involve risks and uncertainties and are not guarantees of future performance or results and no assurance can be given that these estimates and expectations will prove to have been correct, and actual outcomes and results may differ materially from what is expressed, implied or projected in such forward-looking statements. Echelon Wealth Partners Inc. is a member of the Investment Industry Regulatory Organization of Canada and the Canadian Investor Protection Fund.
Share This Post

Call our office today for a private consultation about your Beyond Wealth needs.

Team Lairar
1565 Carling Avenue
Suite 600
Ottawa, Ontario
K1Z 8R1
LINKS
JOIN OUR MONTHLY NEWSLETTER
Contact Us


Please note that only Echelon Wealth Partners is a member of CIPF and regulated by IIROC; Chevron Wealth Preservation Inc. is not. *Insurance Products provided through Chevron Preservation Inc.